News images of Los Angeles Wildfires, January 2025
This page is referenced by:
-
Climate Change
Introduction
Prof Daniel Samson -- dsamson@brocku.ca
Course Coordinator - Dr Trudy Tattersall -- ttattersall@brocku.ca
Student hours Wednesday, 1 to 3 GL 219, or by appointment!
Climate change is the most important issue of our time. The stakes are no less than the fate of the planet as we know it. In most ways, it's an issue of the future, of repairing or at least mitigating the profound and dangerous impacts we've been having on the planet. But climate change is not new; it's been part of the planet's history since life on earth began. The difference this time, scientists have made clear, is the magnitude of that change: it's greater than ever before recorded. It's also the role of humans: we are causing it. The history of climate change offers us lessons and insight into the nature of climate change, and the ways humans and other living beings have adapted to those changes. It also offers us valuable insights into how we think about climate, how we think about our relationship with climate, as a way of understanding how we got here. Looking at past examples allows us a sense of comparison, of the nature of our problems, and the scale on which they operate.
This course takes a very big-picture look at the larger history of climate change, from the earliest role climate had on the evolution of our species to its influence on the rise and fall of empires, and to its place in politics and society in more recent debates on how to govern lives, our communities, our nations, and our world.Student hours:
Student hours, Wednesdays, 1-3 or by appointment - Office: GL 219 - email: dsamson@brocku.ca
Your TA's contact information will be distributed elsewhere.Provincially-Mandated Notice of Cost of Textbooks
$0.00Course Requirements (explained below)
- Quizzes (10 x 2) = 20 per cent
- Seminar participation = 20 per cent
- 1st assignment = 15 per cent (due Thursday October 8th)
- Long assignment = 20 per cent (due Monday, 30 November)
- Final Exam = 25 per cent (as scheduled by the exam office)
Warning: All of these are required course components. Failure to complete any of these will result in failing the course.
On the other hand: Completing each requirement, and making some reasonable and honest attempt to do them properly, means you would then need to try to fail the course.
On a third hand: If you fall behind, don't give up. Contact Prof Samson, not your TA, and we can almost always work something out (almost always). Though it's better just to stay up-to-date.
Quizzes: weekly, every Thursday, beginning September 24th. Each quiz will have 5 questions; the quiz will be on Brightspace, will start at 8,30 and will be available for 30 minutes - you'll have 10 minutes to complete once you start. The questions will all be multiple choice, or true/false. If you're attending class, and listening/taking notes, it should be a pretty easy way to get 20 points.
Seminar performance: Again, exactly what it says. In seminar, you'll have an assigned reading (or some kind of material) and some guiding questions; we'll discuss that in class and you will be evaluated by the quantity, and more importantly the quality, of your contributions to the discussion. To be clear, you are not being graded on attendance. You're expected to be there and the grading begins after you enter the room, not because you entered the room. Do the reading - come to class - participate.Three hints on seminars:
1. Read. AI has its uses, but it's not a substitute for reading and AI summaries are often shockingly inaccurate. Moreover, every examination of student success shows that students who read the material, learn more and do better than those who run with AI-produced summaries.
2. As you're reading, write notes - don't just highlight stuff, write notes that will help you think about it, and recall it later. Every examination of student success shows that students who take notes do better than those who highlight; every examination of student success shows that students who write their notes by hand retain more and learn more.
3. Talk. Some of you, I know, aren't comfortable talking in class. Shy, anxious. But it's often very helpful to simply try. And, if you take some good notes (see point 1) and then write out a kind of short script of three or four points you think are important, you can find an opportunity to get some of it into the conversation.Seminars are worth 20 per cent of your grade; each seminar will be graded out of ten.
Seminars are worth 20 per cent of your grade; each seminar will be graded out of 10:8 - 10 - Thoughtful, timely and excellent contributions that stimulate discussion and provide insightful comments with solid grounding in the sources and other students’ comments for the week.
6 - 7.5 - Effective contributions that invite comment and demonstrate some knowledge of the sources and other students’ comments. (These are clearly on the right path, but could still be improved.)
5 - 5.5 - Little or no effort given to discussion, and/or the contribution was divergent from the discussion and the readings, and/or demonstrated little effort to engage with other students’ ideas.
3 - You showed up.
0 - You didn't show up.
Your seminars will be led by Teaching Assistants (TAs). There are six TAs in this course. Get to know yours. They are talented and want to help you succeed. Your TA is your primary contact in the course. You'll meet them in seminars, talk about the readings, and they'll evaluate your seminar participation and your written work. If you're unhappy with a grade you receive, talk to them first. If you're still not satisfied, talk to me. If you want to discuss accommodations or extensions, contact me.
Brightspace management: if you want to submit self-declaration forms, discuss missed seminars, or contacting TAs, write to Dr. Trudy Tattersall at ttattersall@brocku.ca.Assignments:
There are two assignment that build skills in both historical climatological methods and traditional historical (textual) methods. All assignments should use Chicago-style references (footnotes, no bibliography required).This course forbids use of generative AI. Read the full course policy on the Course Policies page.
Short Assignment #1 (15 per cent ) - Forms plus 500 word essay, due 8 October:
We’ve seen how proxy measurements are important tools for historical climatology. As we saw, tree-ring analysis is an example of how an object with a past (like a tree), or an object from the past (like wood utilised sometime in the past) can offer us indicators of past climates. They are approximations, not precise tools, but consistent cross-testing and re-testing has shown they offer surprisingly high levels of accuracy when used carefully.
This assignment asks you to engage in a different proxy measurement, one based not on objects but on descriptions of weather found in historical documents - in this case, a 19th-century diary.
In general, the best data comes from a sustained set of measurements taken at one location over a longer period of time. That’s exactly what a modern weather station does: consistent readings from a single place over a long period of time. But that kind of data only begins to be taken in the mid-19th century, and even then only in a few locations. The first permanent weather station in Canada wasn’t in place until 1871, and that was just a single station in Toronto. Here in St Catharines, we know weather can be quite different than Toronto. And then think of St. John’s or Saskatoon, places with very different weather. That’s why proxies are necessary.
Historical diaries offer one possibility. Diaries often record the weather, particularly farm diaries where the diarists were attuned to the weather as they planned the seasonal cycles of ploughing, seeding, harvesting. If such a diary exists for one place over a long period of time, we have a fairly robust source of data that gives us patterns of weather. Was that heavy frost that Jefferson noted in Milan in late April a once-in-a-century freak cold spell, or typical of the area in that time period? Jefferson’s notes – one man passing through – cannot tell us. But if we had a consistently written diary by an 18th-century Lombard farmer, we could. We don’t have that diary, but we have some others that can serve as examples of how it might be done.
This assignment will have you read one week entries from the diary of a Nova Scotia miller by the name of James Barry. Few diaries run such a long time, or are this consistently maintained: he recorded the weather, almost every day for over 56 years. Each of you will read a single week from the diary and record his weather notes for that week. That again is a small sample. But as a class we can produce almost 4 years of data and then reassemble that data and begin to create a profile of the weather in Pictou County, Nova Scotia in the 1860s. This kind of crowd-sourced approach is a powerful tool in basic “citizen science” – that is, where, together, ordinary folks like you and me can transcribe and record data from old sources, upload that data into a database, and help create data that would otherwise be very labour intensive to assemble. As the saying goes, many hands make light work.
The diarist, James Barry, was a miller, a printer, a fiddler, a reader, and something of a curmudgeon. His parents were immigrants from Scotland, arriving in Nova Scotia around 1810 and Barry was born in 1819, the youngest of eleven children. He was a deeply religious man and for much of his life he was a devout Presbyterian. However, in the period you're reading, he was beginning to drift away from the church and would come to embrace the liberal-secularist ideas of American and British Free Thinkers of the late 19th century. He had a lot of health problems, as you'll probably see, but he lived a good long life. The entries you're reading begin in the mid-1860s when he was in his mid-40s - he'll live another forty years, dying in 1906 at the age of 86. He was married, though it was a very unhappy marriage, and they had two daughters, Josephine and Bessie. At the point we're reading, James and his wife Isabel had spoken very little since a major fight in 1867. But for all that, what we'll observe is that he was certainly a keen observer of the weather.
Instructions - step-by-step instructions and the diary pages will be available September 17th.Describe and explain your data, particularly noting not only the data itself but how you interpreted non-specific language [what does “cold” mean in June? What does it mean if he says the day was “soft”, what does it mean if he says it's warm "for this time of the year"?, what numbers did you attach to these imprecise, often abstract, terms?, and so on] \
Elaborate on context – this data is imprecise and requires interpretation – explain which context(s) helped you to interpret the imprecise language. What numbers did you attach to these imprecise, often abstract, terms?
Devote approximately two thirds of your space to weather, and about a third to the diarist and his personal/community context. Some of that will relate to weather; some won't. I offer some of that context for you above; but look for evidence in your entries.
Explore the possibilities [what insights such data might open up to us] and the limits [what else we would need to make such data more useful] of such diary-based data. In a nutshell: highlight the climate data, record it, explain it, submit it.
.Longer assignment (20 per cent, 1000 words, due 30 November):
Your second assignment is much the same except this time you'll be comparing two locations. We're asking you to put together a second piece of weather data and to compare it with the first. You're also asked to utilise two secondary sources. Find them, and other tips, on the instructions page.
Guelph University’s digital Rural Diary Archive has several diaries from the same period that are already transcribed. Download the transcript for the year from which your first transcription came and then identify the same dates (or at least as close as you can - this diarist doesn't write every day). As in your first assignment, you'll record this data in a new table [follow the instructions here]. You'll write about this diary in much the same manner (two thirds on the weather/climate data, one third on more general matters). But the major task is to compare the two diaries as sources of data. Indeed, you can assess their comparability (are they very similar in how they describe the weather? very different? too different?) Think about what new insights we can gain from this comparison and what we’d need to do to build/refine/improve this data?
David Allan was a miller, distiller, and one of the leading men in mid-19th-century Guelph. His operation was much larger than Barry's. His mill ws five stories high and he also owned a cooperage, blacksmith shop, stone quarry, lime kiln and two farms. Farmers from the surrounding area brought their grains to be ground into flour and meal. He in turn sold part of that flour - his "toll" - and used some of the grain in his distillery.
He wrote less about weather than did Barry, and so you may find yourself with less weather data to discuss. That's ok. You can still compare the two diaries and diarists; you can reflect on the process of finding weather data. Think of ways the lack of data can be useful for us in thinking about researching climate history.
You're asked to undertake the same basic analysis and reflection - noting how you interpreted non-specific language, how you "converted" such language into numbers, how context helped your interpretation - and to think about how such data helps us undertake climate history, and how our diarists and communities were affected and/or thought about their experiences with weather.
Here too you are to think about the possibilities [what insights such data might open up to us] and the limits [what else we would need to make such data more useful] of such diary-based data. But. Now you have two datasets. Discuss how this expands our knowledge, and what yet needs to be done.
And, as last time, devote approximately two thirds of your space to weather, and about a third to the diarist and his personal/community context. In some ways those will be linked, but try to find roughly this balance - and to be clear, roughly two thirds and one third - nobody will be counting words here to make sure you're exactly on these ranges. Just make a reasonable effort to do both in roughly this proportion.
As on the first assignment, you should also pay attention to these basic questions:
This time, though, two additional components:Explain your data, particularly noting how you interpreted non-specific language [what does “cold” mean in June? What does it mean if he says the day was “soft”, what does it mean if he says it's warm "for this time of the year"?, and so on] -
Elaborate on context – this data is imprecise and requires interpretation – explain which context(s) helped you to interpret the imprecise language.
Explore the possibilities [what insights such data might open up to us] and the limits [what else we would need to make such data more useful] of such diary-based data.Compare the data from the two sites. Are the similar? Different? How so?
Complete your Forms.Then, for the final submission, in Brightspace submit two components: 1. the section from the diary [as text, as a screenshot, whatever - so long as your TA can read it]; 2.. your 1000-word assignment.
Using the provided secondary sources, consider other contexts and considerations of bias.
And when this is completed, together we will have a new climate database - a small one, to be sure, but a contribution to international efforts to better understand climate history. You're not just learning about climate science - you'll be contributing to it!In a nutshell: highlight the climate data in a new source, compare it with the first source, reflect on bias, limits, and possibilities.
We can reassemble all that data to create two data points: one in Peel County, Ontario and another in Pictou County, Nova Scotia. We can then contribute that to the international Historical Climatology research group. We (and others) can also compare our results with other research such as the North American Drought Atlas which uses tree-ring data to map historical patterns of drought across the continent. Two data points do not make a pattern; but hundreds of groups doing similar research can.Looking for a different way to express your thoughts? As an alternative for this final assignment, you may make a short documentary video, or podcast. More detailed guidelines for alternative formats can be found here.
Final Exam (25 per cent, scheduled by the exam office):
We'll discuss the exam at more length later in the term, but the format will consist of three sections: one third short answers (you'll have some choice here); one third on one essay (you'll have some choice here); one third one longer essay on a question I'll give you in advance (you won't have any choice here).Struggling? Talk to your TA; talk to me. Also know that Learning Services offers free workshops, drop-in tutoring, and online academic resources. Tutoring by upper-year Brock students is also available on a pay-per-hour basis. Visi http://brocku.ca/student-life-success/learning-services/ for more information. Coming to talk to your TA (or me!) is free.
By the end of this course, students will be able to:
Learning Outcomes:
1. describe different historical climate change events, some of their causes, and some of their effects
2. assess the relative impact of different degrees of historical climate shifts
3. explain and describe historical and interdisciplinary research methods
4. explain the application of historical research methods in understanding climate change todayAdministrative Policies
Policies related to accommodations, academic integrity can be found here.A week-by-week outline:
Week 1: September 9 - Introduction: Scale, Climate Science and History- No seminars this week.
Week 2: September 14-18 - Lecture:"Living in a Warming World"
Seminar reading: Andrea Duffy, (2024). "Weather or Not: A Brief Introduction to Climate History". Agricultural History, 98, 3, 413–426. [abridged]
This week I'd like us to talk about these basic questions:- what is aim of climate history? why do we need to know this?
- how is climate history the same, or different, from other histories?
- what topics do climate historians pursue?
- what methods do climate historians use?
Week 3: September 21-25 - The Classical Era: Rome and Han China
The big question our readings ask, is how do climate historians find data on historical climates when no direct measurements exist? It’s only in the past 200 years that we have records of instrument-based measures of weather. How do we measure before that?
These short pieces offer us an introduction to paleoclimatology - that is, methods for measuring climate before humans invented climate-measuring tools in the past few hundred years. This is pretty heavy science, but we can understand the basics - you're being asked to understand the principles, not conduct work in the field!!
Seminar readings:
For each of the following, you should be able to describe what they're doing, why they're doing it, and how accurate the method is. Read two of these three.- Patricia Lonergan, "Solving a Climate Puzzle, One Tree Ring at a Time", University of Toronto Magazine, April 2023.
- Ann Finkbeiner, "The Scientist Who Reads a Lost History in the Mud", Hakai Magazine Oct 2017
- Bess Connolly, "Study reshapes understanding of climate change’s impact on early societies", Yale New, Oct 2017
For each of these, I'd like you to tackle the following basic questions:
- in each piece, what is the proxy, what does it attempt to do, and how does it work?
- each story is about a scientist working with history - what's history, and how does the science help?
- can we identify aspects of the "archives of nature" and the archives of society" and explain they complement each other.
Week 4: Sept 28 - Oct 2 - The Middle Ages- Seminar reading: Kyle Harper, “The Environmental Fall of the Roman Empire” Daedalus, 145, 2 (2016): 101–111.
- Questions for seminar:
What exactly is Harper arguing? Is he saying climate change caused the empire to fall, or is he being more subtle than that? What evidence does he offer? Itemise some of this evidence. How did he obtain this evidence? Discuss the importance of proxy measurements to his argument. Is the evidence convincing? Can you spot evidence from written sources? (i.e. from archives of society) Can you spot evidence from natural processes? (i.e. from archives of nature) Do you find any of this evidence more, or less, convincing?
1st assignment due, Thursday, October 8th
Week 5: October 5 - 9 - The Little Ice Age
Seminar reading: Philip Jenkins, Climate, Catastrophe, and Faith: How Changes in Climate Drive Religious Upheaval (New York, Oxford University Press, 2021), 43-59 [abridged].- For the next two weeks we'll read two chapters from Philip Jenkins's book, Climate, Catastrophe and Faith, which describes how climate was part of the history of the massive upheavals within world religions in the past two thousand years. This week, reflecting our lecture on the medieval warm period, we follow his chapter, entitled "Age of Gold", which highlights the expansive, prosperous and optimistic worldview of that era. We'll contrast that next week with a focus on the late medieval/early modern era when climate cooled dramatically. As the book's title suggests, Jenkins argues that climate drove religious upheaval. What events is he describing? Discuss his evidence. Is that evidence convincing? How effective is his argument?
October 12 - 16 Study Break
Week 6: October 19-23 - Colonialism and Human-Directed Climate Change
Seminar reading: Philip Jenkins, Climate, Catastrophe, and Faith: How Changes in Climate Drive Religious Upheaval (New York, Oxford University Press, 2021), 60-85 [abridged].
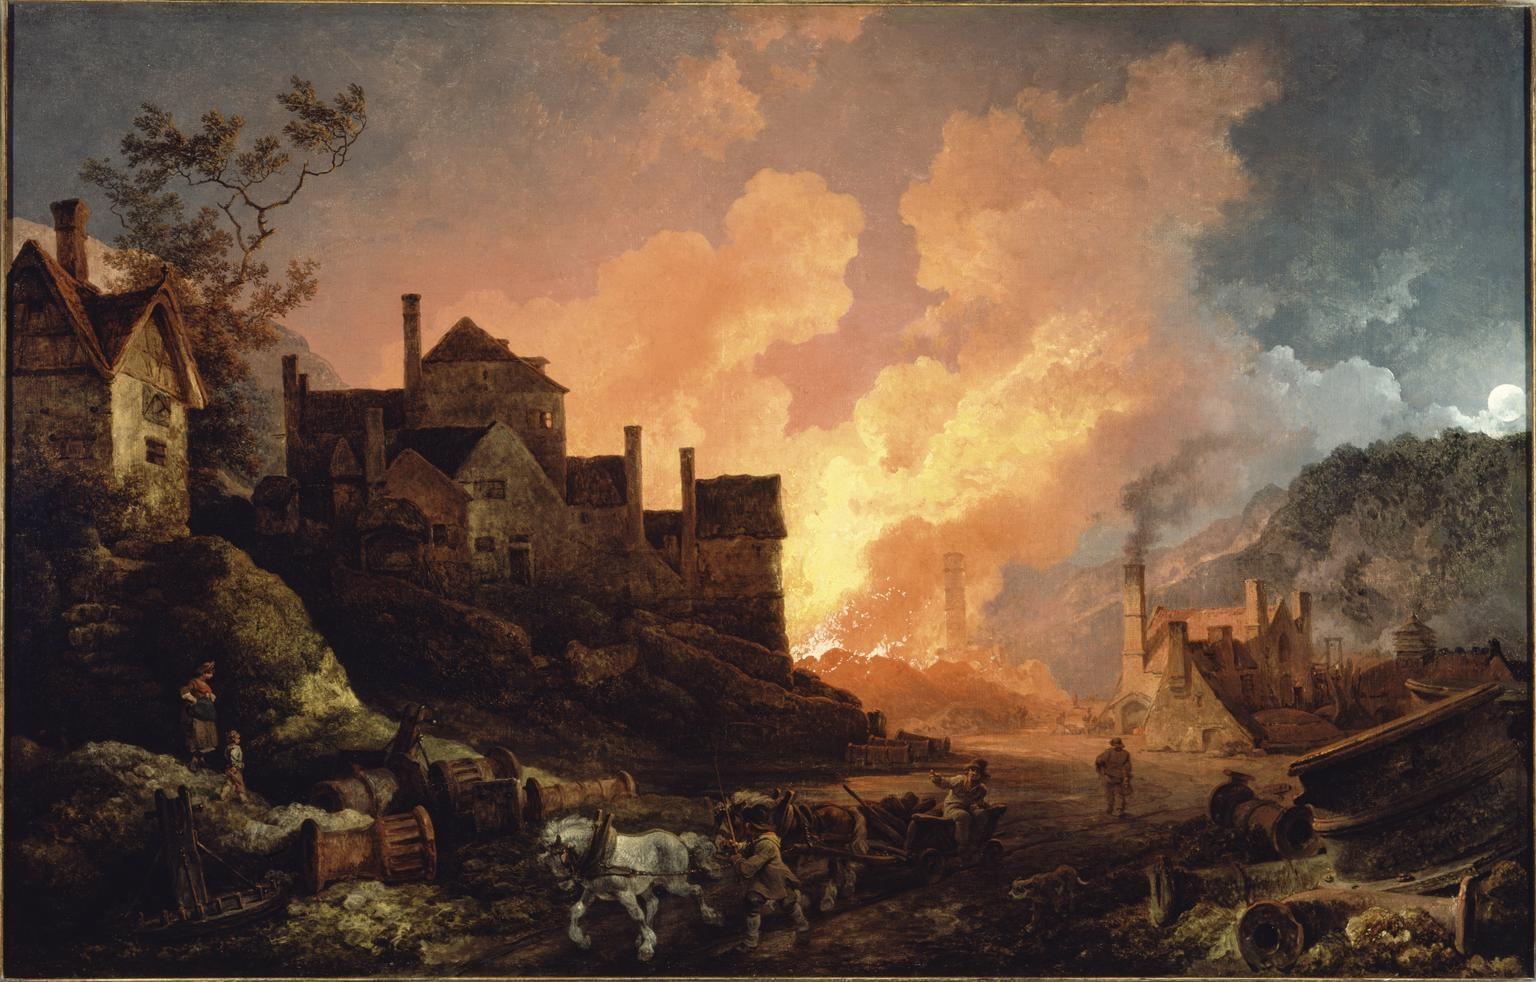
Week 7: October 26 - 30 Industrialisation: Coal and the Early Age of Fossil Fuels
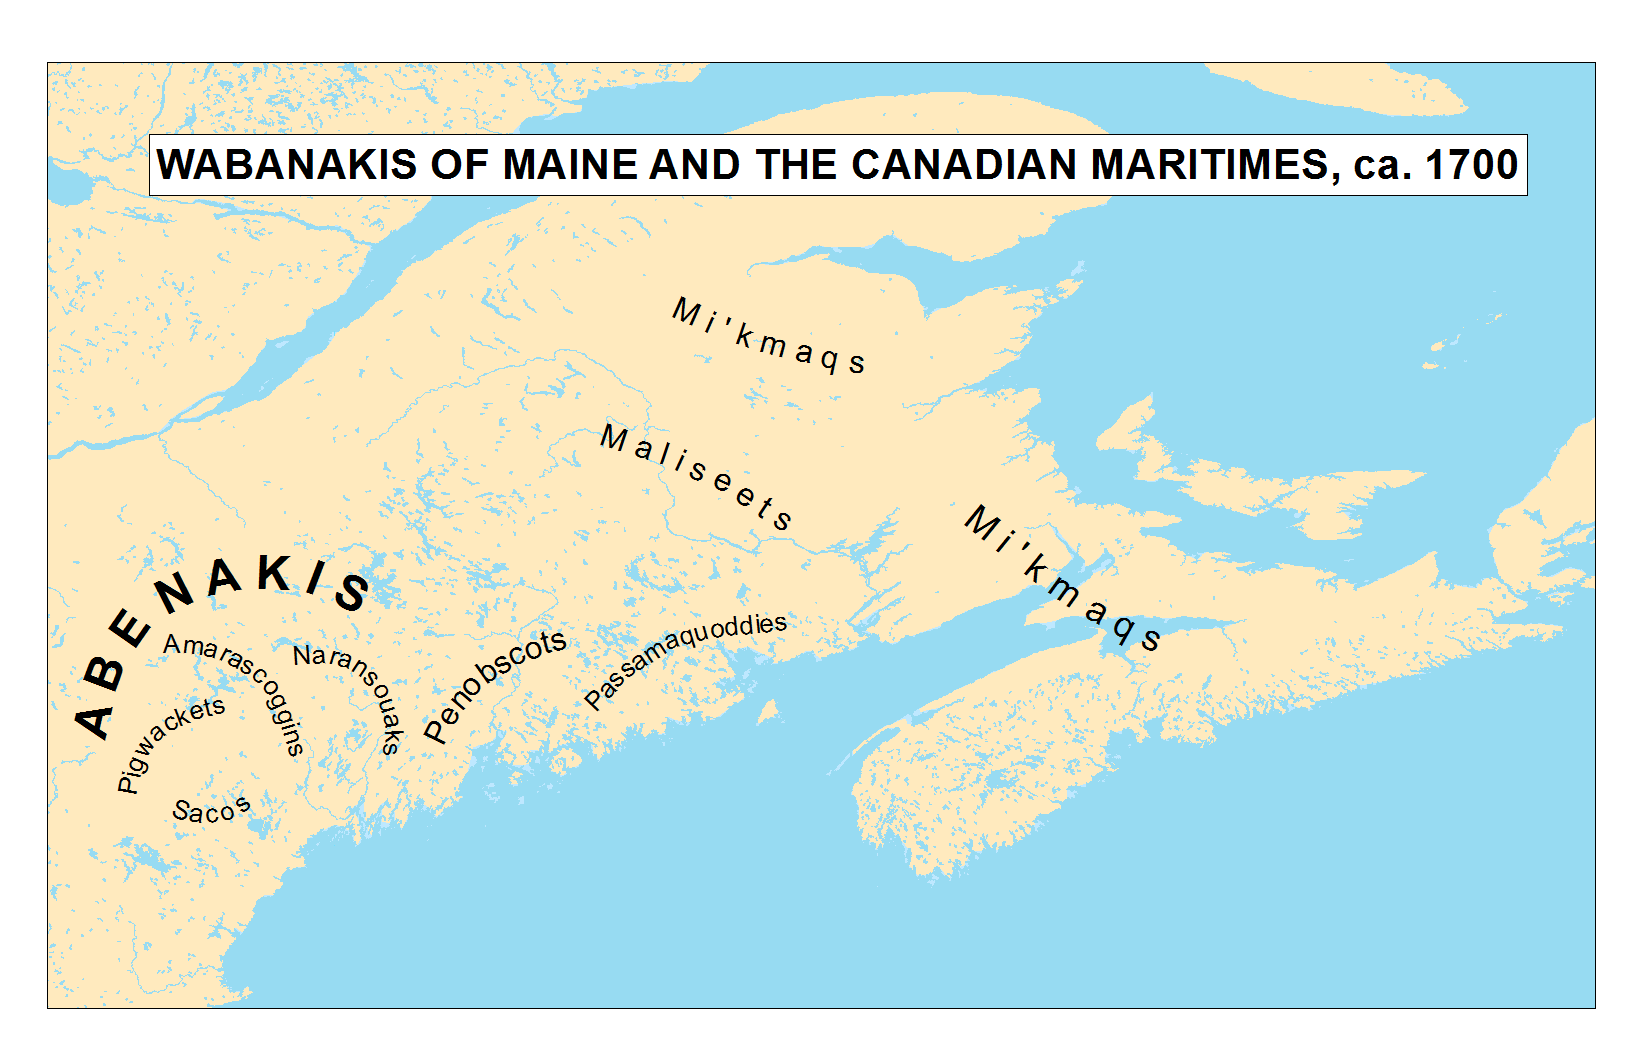
This week in seminar, a discussion of climate change in colonial America. Wickman is interested in Indigenous peoples [the Wabanaki, a confederacy of Abenaki, Penobscot, Maliseet, and Mi'kmaq nations who lived in what is today New England and Maritime Canada] and their relationship with British colonials. Set at the height of the Little Ice Age, Wickman explores how these peoples responded and adapted to climate change. How did climate (and climate change) influence this colonial encounter? How did climate and climate change offer the Wabanaki peoples advantages?
Keep in mind our discussions of how different peoples responded differently to climate changes. Was climate, or culture, the key feature of success in the Wabanaki wars? Recall, too, from lecture how New Englanders and Nova Scotians believed that advancing British civilisation would also warm the climate. Did the experience of war change that view? Did climate impact how people remembered the Wabanaki Wars?
And let's also this week spend some time thinking about the type of publication you're reading. Examine Wickman's sources. Do his footnotes allow us to see from where is he drawing his evidence? Does this lend credibility to his work? Where is it published? And who is Thomas Wickman? Do these things offer us reasons to accept the findings? What does lend support to your sense of whether to accept findings?
Read- Thomas Wickman, (2015). “'Winters Embittered with Hardships': Severe Cold, Wabanaki Power, and English Adjustments, 1690–1710", William and Mary Quarterly, 72(1), 57–98. [abridged].
Week 8: November 2 - 5 - The Anthropocene - The Tipping Point?- Seminar reading: Vaclav Smil, Grand Transitions: How the Modern World Was Made (New York, Oxford University Press, 2021), pp.114-35.
Vaclav Smil is a historian of energy. Just recently retired from the University of Manitoba, he has written over twenty books and hundreds of articles on climate, energy, and their connections to our civilisation. Unlike most of our readings, Smil is not primarily focussed on climate; instead, his focus is the history of energy. Yet, as you're reading this, you'll see he makes clear that his discussion is also about climate, and that the two histories are very much related. What did the expansion of coal use mean for the modern world?
Week 9: November 9 - 13 - Fordism
How was coal-fired electrification made invisible? Why is that important to our understanding of climate history? Hydro power is cleaner still, but didn't catch on. Why? In the second half of the chapter, French turns to a discussion of consumerism. How were electrification and consumerism related? Are there lessons here for out own understanding of electricity in our world?- Seminar reading: Daniel French, When They Hid the Fire: A History of Electricity and Invisible Energy in America (New York, University of Pittsburgh Press, 2017), 122-41.
Week 10: November 16-20 - The Great Acceleration
This week, we'll read two short blog posts from Canadian historians associated with NiCHE, the Network in Canadian History & Environment/Nouvelle initiative Canadienne en histoire de l'environnement, a major academic research group that has emerged in Canada over the past twenty years. Focused on environmental history generally, many of their researchers focus on the issue of climate change. Energy history, in particular, has become a focus of their work, and this week we see work focused on mining and hydro power. What does the evidence associated with the expansion of hydro power and mining tell us about the acceleration of climate change and carbon emissions in the 20th century? Sandlos's essay focuses on an earlier period. What does that do for our analysis of the "Great Acceleration"?- Daniel Macfarlane, "Hydro Power, Energy Transitions, and the Onset of Canada’s Great Acceleration" NiCHE Blog May 13, 2026.
- John Sandlos, "Mining Data and Canada’s Great Acceleration" NiCHE Blog, May 20, 2026.
The campaign to reduce emissions: how's it going?
Source: Statista
Week 11: November 23-27 - The Outlook
This week inj seminar we're having writing workshops for your final assignment. Instructions will follow on Brightspace as we approach the date.
There is one required reading, plus some sample paragraphs:- Seminar reading: Renée Sieber, Victoria Slonosky, Linden Ashcroft, & Christa Pudmenzky, (2022). "Formalizing Trust in Historical Weather Data", Weather, Climate, and Society, 14 (3), 993–1007.
second assignment due, Monday, November 30th
Week 12: Nov 30 - Dec 4 - A History of the Future- Seminars: exam review